ParetoSaddlerPareto-Guided Optimization of Agent Harnesses
for Quality and Cost

Xingzhi Qian 1 * Sungho Park 2 * Rongyuan Tan 3 * Jianbo Yu 4 * Jue Zhang 5 †
Lorenzo Cavallaro 6,1 Menglin Xia 5 Yanzhi Chen 5 Xinnuo Xu 5 Yu Kang 5 Xinran Zheng 1
Gagan Somashekar 5 Xuchao Zhang 5 Chetan Bansal 5 Qingwei Lin 5 Victor Rühle 5
1 University College London 2 Pohang University of Science and Technology 3 Southern University of Science and Technology 4 Southeast University 5 Microsoft 6 Mohamed bin Zayed University of Artificial Intelligence

*Work done during an internship at Microsoft. †Corresponding author.

Preserve valuable quality–cost trade-offs during optimization.
Select the final harness at deployment.

ClawMark
+10.49 pp

higher quality

70.86% → 81.35%
−13.7%

execution cost

$1.17 → $1.01 / task
GAIA2
+6.67 pp

higher quality

56.22% → 62.89%
−42.3%

execution cost

$0.78 → $0.45 / task

Abstract

Harness optimization can substantially improve LLM agents without modifying model weights, but existing methods primarily optimize response quality. Extending them to joint quality–cost optimization introduces a challenge: applying the deployment preference during intermediate updates can prematurely reject candidates that are valuable for later improvements. We introduce ParetoSaddler, which addresses this mismatch by separating intermediate candidate promotion from final deployment selection. At each iteration, an optimizer updates a parent harness to produce a candidate, and then compares the two over repeated executions and uses Bayesian bootstrap Pareto support to promote candidates showing credible progress in either quality or cost. Promoted candidates receive broader development evaluation and remain available as parents for later optimization steps. We evaluate ParetoSaddler on ClawMark and GAIA2 using domain-disjoint splits. On ClawMark, ParetoSaddler improves quality from 70.86% to 81.35% while reducing cost from $1.17 to $1.01 per task; on GAIA2, it improves quality from 56.22% to 62.89% while reducing cost from $0.78 to $0.45 per task. The Pareto-selected harnesses also achieve higher quality at lower cost than quality-only harness optimization. Analysis shows that Pareto-aware optimization retains intermediate candidates that would be discarded by deployment preference but can support later improvements, while Bayesian bootstrap screening filters out candidates whose gains are weakly supported across runs.

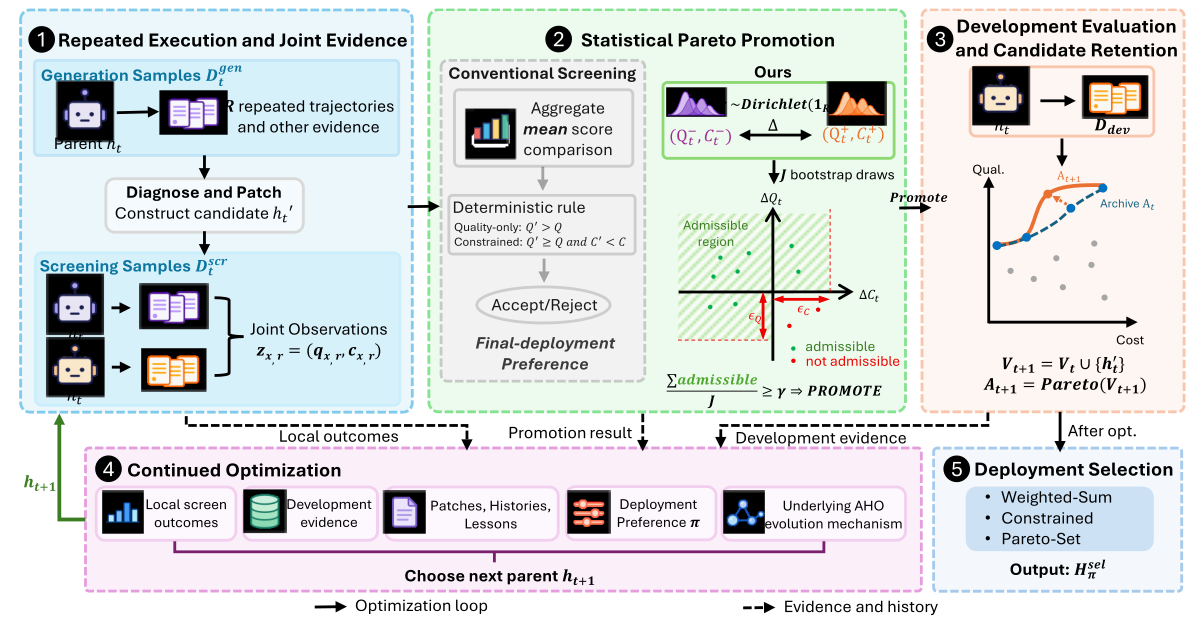
Method Overview

ParetoSaddler's five-stage loop: repeated execution, statistical Pareto promotion, development evaluation and retention, continued optimization, and final deployment selection.
The ParetoSaddler loop. Local evidence determines promotion; the development-evaluated candidate pool and its Pareto archive support further optimization. The deployment preference governs the final selection.
  1. Repeated Execution and Joint Evidence

    Use repeated parent executions, trajectories, and paired quality–cost observations to construct a candidate. Screen the parent and candidate under the same evaluation protocol, with R executions per task.

  2. Statistical Pareto Promotion

    Use Bayesian bootstrap draws to assess support for improvement in either quality or cost, subject to local allowances. Promote the candidate when the fraction of draws satisfying the promotion event is at least γ.

  3. Development Evaluation and Candidate Retention

    Evaluate promoted candidates on the development set with R executions per task. Update the empirical Pareto archive while retaining all development-evaluated candidates, including those outside the archive.

  4. Continued Optimization

    Use the development-evaluated set, Pareto archive, accumulated optimization state, and deployment preference to choose the next parent. The preference may guide the search but does not act as a hard intermediate filter.

  5. Deployment Selection

    After the optimization budget is exhausted, apply the deployment preference to the final development-evaluated set. Return a single harness under weighted-sum or constrained selection, or the empirical Pareto set for frontier discovery.

Statistical promotion rule

Bayesian bootstrap reweights repeated runs. Count draws where quality improves, or cost falls with at most 10 pp quality loss.

Bayesian bootstrap changes in quality and cost for ClawMark I-12 Green regions support promotion: quality improves, or cost decreases with a quality loss of at most 10 percentage points. Each dot is one of 500 displayed draws from 10,000 draws recomputed using rounded observations. -40% -20% 0% + 20% + 40% -20 -10 0 + 10 + 20 ΔC ΔQ Quality improves −10 pp quality-loss allowance
Supports promotion Does not support

Optimization Trajectories

Iteration 0 / 17
Arrowheads show the direction of harness updates. Dashed gold lines show the current Pareto frontier. Rejected proposals have no development point. Response Quality Cost per task
Harness update Pareto frontier Evaluated
INITIAL
Initial harness66.13% / $1.45

Diagnosis

The starting point before ParetoSaddler optimization.

Patch

Prompts, tools, middleware, and control logic have not yet been updated by this run.

Results

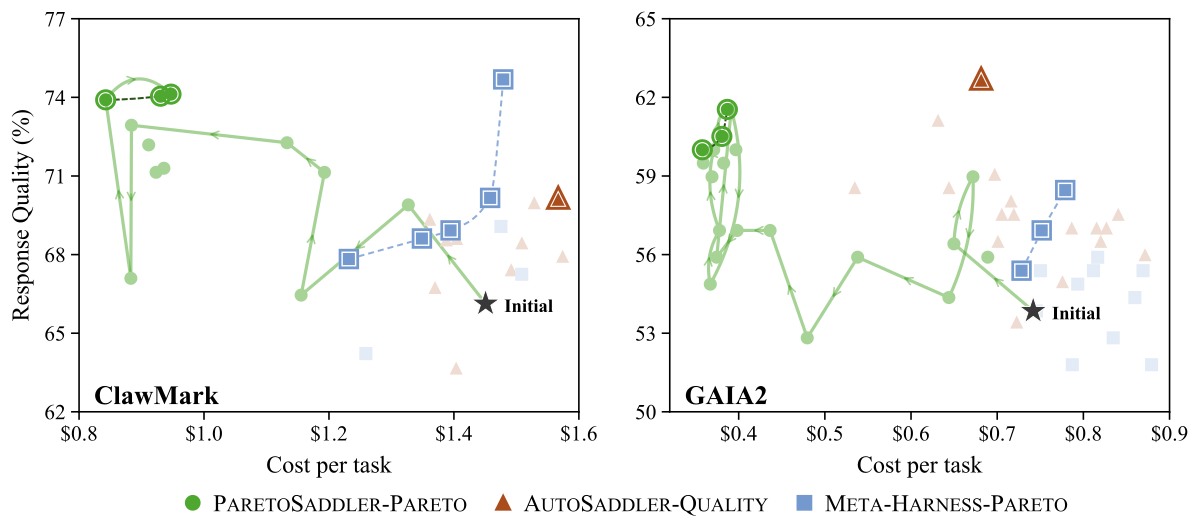
Development quality–cost trajectories for ClawMark and GAIA2, comparing ParetoSaddler, quality-only AutoSaddler, and Meta-Harness. Stars mark the initial harnesses; larger outlined markers identify the final candidates.
Development quality–cost trajectories on ClawMark and GAIA2. Larger outlined markers show the final candidates; better operating points lie toward the upper left.

Test Results

Held-out test results on ClawMark and GAIA2, including GAIA2 universe-level results
Setting Metric Overall GAIA2 by Universe
ClawMark GAIA2 U21 (107) U22 (112) U27 (81)
Default Agent Qual. ↑ 70.86 ± 2.29 56.22 ± 1.07 58.26 ± 1.08 53.57 ± 1.55 57.20 ± 2.57
Cost ↓ 1.17 ± 0.17 0.78 ± 0.08 0.82 ± 0.18 0.71 ± 0.03 0.82 ± 0.04
AS-Quality Qual. ↑ 73.86 ± 3.54 57.33 ± 0.67 55.76 ± 4.70 53.87 ± 5.67 64.20 ± 1.23
Cost ↓ 1.24 ± 0.04 0.61 ± 0.03 0.55 ± 0.02 0.62 ± 0.04 0.67 ± 0.05
MH-Pareto C Qual. ↑ 70.50 ± 3.92 55.44 ± 1.50 58.26 ± 3.28 50.00 ± 2.68 59.26 ± 3.27
Cost ↓ 0.97 ± 0.05 0.80 ± 0.01 0.76 ± 0.01 0.78 ± 0.02 0.89 ± 0.02
MH-Pareto Q Qual. ↑ 73.25 ± 5.88 54.33 ± 2.03 57.63 ± 3.28 49.40 ± 1.36 56.79 ± 3.27
Cost ↓ 1.06 ± 0.06 0.83 ± 0.04 0.87 ± 0.06 0.75 ± 0.01 0.89 ± 0.07
PS-Pareto C Qual. ↑ 79.60 ± 2.43 62.11 ± 2.46 63.24 ± 4.80 59.23 ± 1.03 64.61 ± 3.77
Cost ↓ 0.92 ± 0.08 0.47 ± 0.00 0.44 ± 0.01 0.49 ± 0.02 0.47 ± 0.00
PS-Pareto Q Qual. ↑ 81.35 ± 3.11 62.89 ± 2.14 61.99 ± 2.35 60.71 ± 2.36 67.08 ± 1.89
Cost ↓ 1.01 ± 0.02 0.45 ± 0.02 0.39 ± 0.01 0.49 ± 0.03 0.46 ± 0.02

Quality is reported in %, cost in USD per task. Values are mean ± sample standard deviation over three test repeats. Bold and underlined means mark the best and second-best displayed results. Superscripts Q and C identify the quality- and cost-extreme harnesses selected on development data.

Evaluation setup and how to read the results

ClawMark: OpenClaw with GPT-5.4 (high reasoning); quality is normalized stage-0 rubric score. GAIA2: the default ReAct-style harness with GPT-5.5 (medium reasoning); quality is Pass@1. Both use domain-disjoint training, development, and test splits.

ParetoSaddler is instantiated on AutoSaddler. All optimizers use GPT-5.5 at xhigh reasoning effort through the GitHub Copilot SDK. Cost is LLM token cost in USD per task under a fixed price card. Values are mean ± sample standard deviation over three test repeats.

PS-ParetoQ / PS-ParetoC: quality- and cost-extreme harnesses selected from the development Pareto set; their test ordering can differ. MH denotes Meta-Harness; AS denotes the quality-only AutoSaddler adaptation.

Ablation Studies

RQ1: How does Pareto-aware promotion enable better optimization outcomes?

Pareto-aware promotion preserves useful intermediate trade-offs. In the controlled PS-MinCost ablation, it promotes 11 candidates versus 3 under the MinCost gate, reaching higher final test quality at lower cost.

I-11 raises mini-batch quality from 83.65% to 87.62% while increasing cost by 10.5%. Retaining this update enables further optimization toward I-14 and I-16, illustrating why intermediate promotion and deployment selection should remain separate.
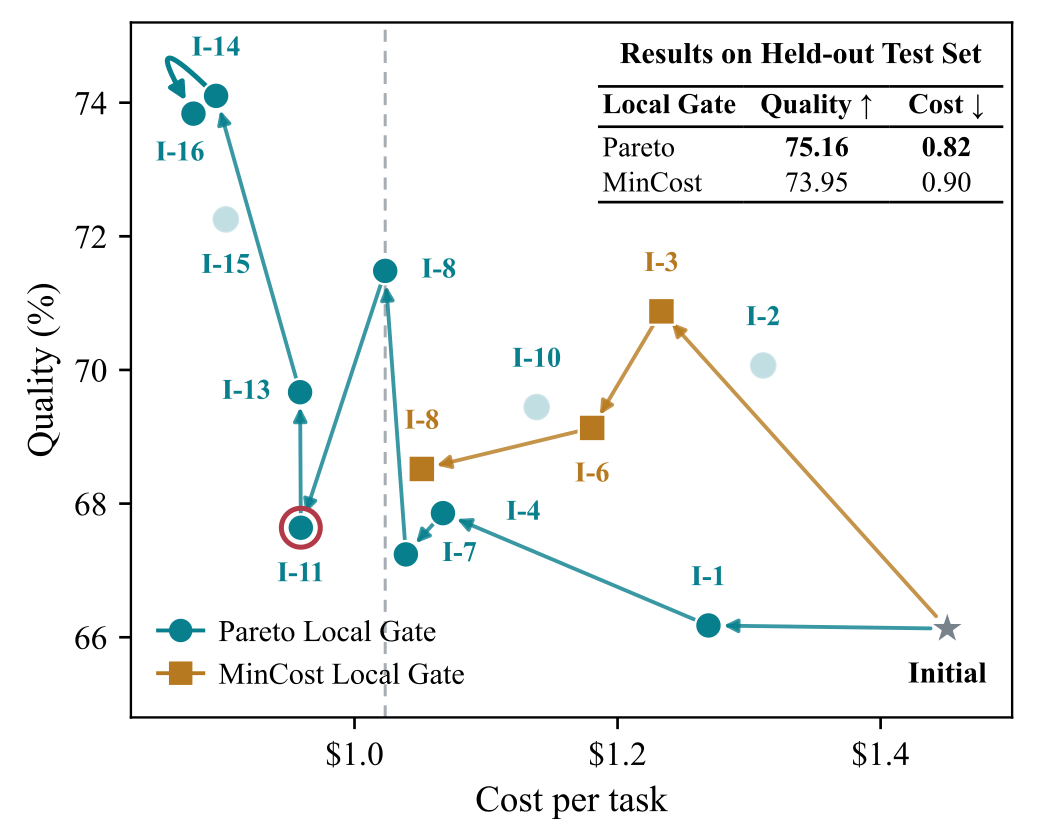
ClawMark development quality–cost trajectories under Pareto and MinCost local gates. The Pareto trajectory continues through I-11 to later quality gains; an inset compares the final held-out quality and cost.
Optimization trajectories under Pareto and MinCost local gates.

RQ2: How do repeated executions improve harness optimization?

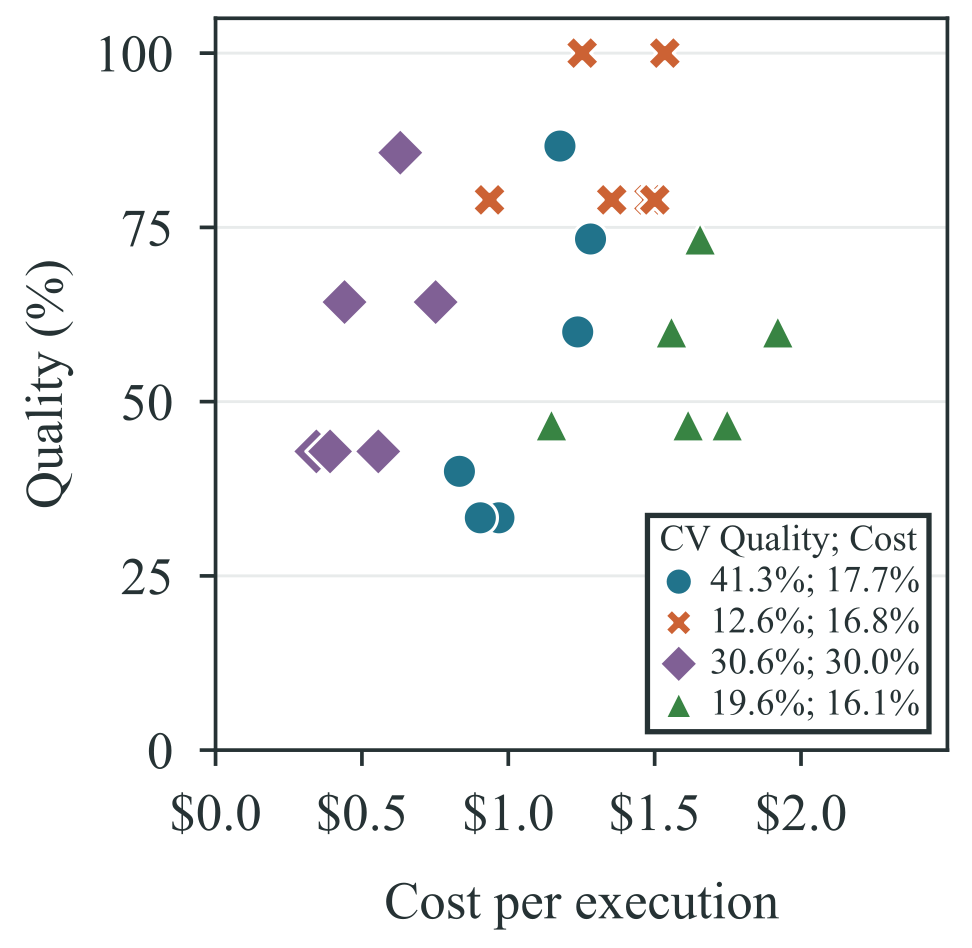
Repeated execution provides richer evidence for diagnosis and patch verification. Persistent failures, mixed outcomes, and efficiency contrasts reveal behavior a single run can miss.

ClawMark single-run versus three-run PS-Pareto ablation
Setting Quality (%) ↑ Cost per task ($) ↓
Single-run C 76.95 ± 5.50 0.95 ± 0.06
Single-run Q 75.71 ± 2.10 0.97 ± 0.05
Three-run C 79.60 ± 2.43 0.92 ± 0.08
Three-run Q 81.35 ± 3.11 1.01 ± 0.02

Three-run optimization raises quality-oriented test quality by 5.64 points and improves the cost-oriented endpoint. This end-to-end comparison uses additional task executions; it is not compute-matched.

Quality versus cost for six executions of each of four sampled ClawMark tasks. Marker colors distinguish tasks, and the legend reports within-task coefficients of variation for quality and cost.
Run-to-run quality and cost variation on four tasks.

RQ3: Does Bayesian screening improve promotion under execution uncertainty?

Bayesian screening filters gains weakly supported across repeated runs. It reaches higher test quality at lower cost than mean-based screening at both endpoints.

ClawMark mean-based versus Bayesian screening under PS-Pareto
Setting Metric Mean-based Bayesian
PS-ParetoC Qual. ↑ 76.86 ± 5.41 79.60 ± 2.43
Cost ↓ 1.09 ± 0.09 0.92 ± 0.08
PS-ParetoQ Qual. ↑ 76.53 ± 2.12 81.35 ± 3.11
Cost ↓ 1.15 ± 0.04 1.01 ± 0.02

I-12 passes the mean-based gate but has only 0.55 support, below γ = 0.7. In the separate end-to-end ablation, Bayesian screening gains 4.82 quality points at the quality-oriented endpoint while reducing cost from $1.15 to $1.01.

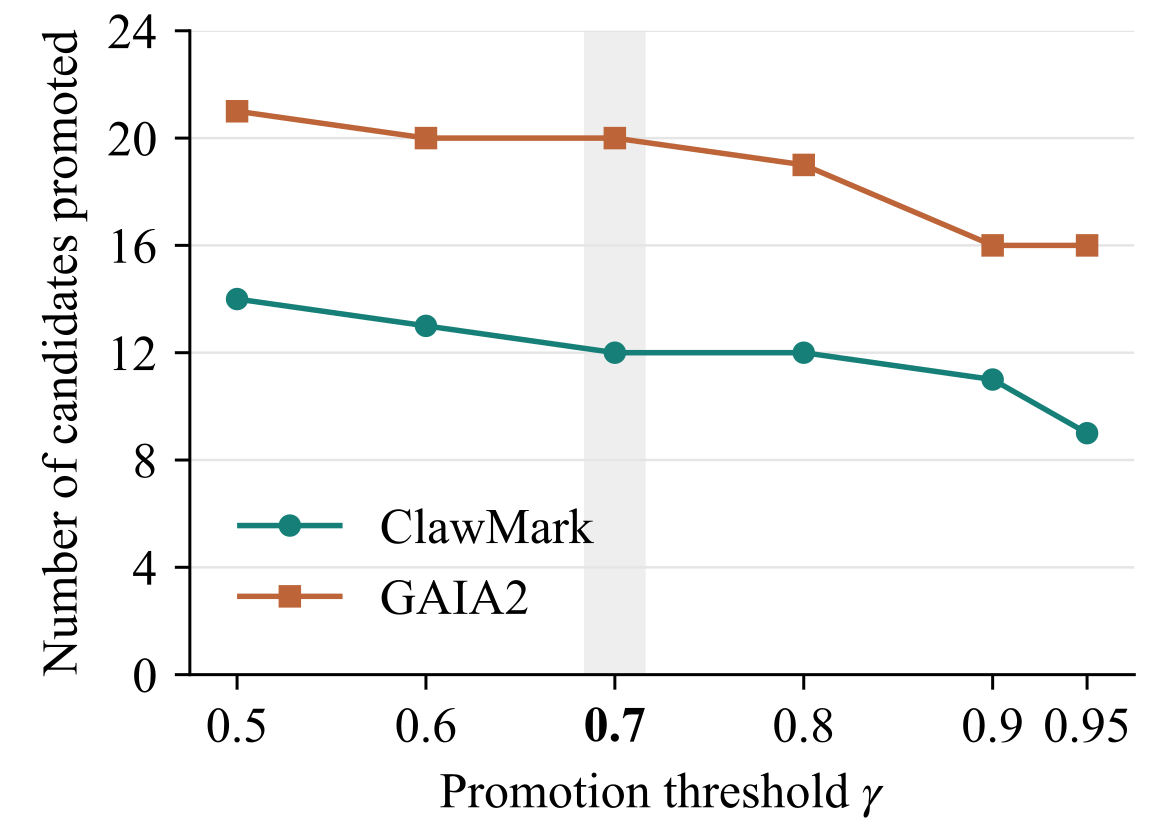
Number of archived proposals that would be promoted on ClawMark and GAIA2 as the promotion threshold increases from 0.5 to 0.95. A shaded band marks the experimental setting of 0.7.
Retrospective threshold replay: γ = 0.7 is locally stable on both benchmarks.

BibTeX

@misc{qian2026paretosaddler,
title={ParetoSaddler: Pareto-Guided Optimization of Agent Harnesses for Quality and Cost},
author={Xingzhi Qian and Sungho Park and Rongyuan Tan and Jianbo Yu and Jue Zhang and Lorenzo Cavallaro and Menglin Xia and Yanzhi Chen and Xinnuo Xu and Yu Kang and Xinran Zheng and Gagan Somashekar and Xuchao Zhang and Chetan Bansal and Qingwei Lin and Victor Rühle},
year={2026},
eprint={2611.02079},
archivePrefix={arXiv},
primaryClass={cs.AI},
url={https://arxiv.org/abs/2611.02079}
}